Biological Metrics

Body Composition Is A Symptom Of Your “Metabolic Health” - Your Metabolic Health Is A Result Of Your “Lifestyle”.

So, how do you know what your level of health is?


70 LB Kettlebell Snatch @ 62 years old.

View my condition 10 years before @ 52 years old here.

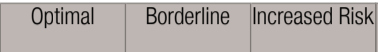
These are the biological markers Hormesis Health and Fitness prefers.

We could discuss how many metrics are too many or not enough. These are better than almost all “biometric screenings” I have seen. Why? Because many don’t measure the right things and many don’t interpret them meaningfully.

Focus on these metrics as a baseline and your health and fitness will line up with that you “were evolutionarily meant to have”.

Metabolic Health Is The Foundation Of Cardiovascular Health

These metrics are the outcome of Lifestyle; the habits and behaviors are what influence them.

The “Physical Health Model” that represents the components of Hormesis Health and Fitness.

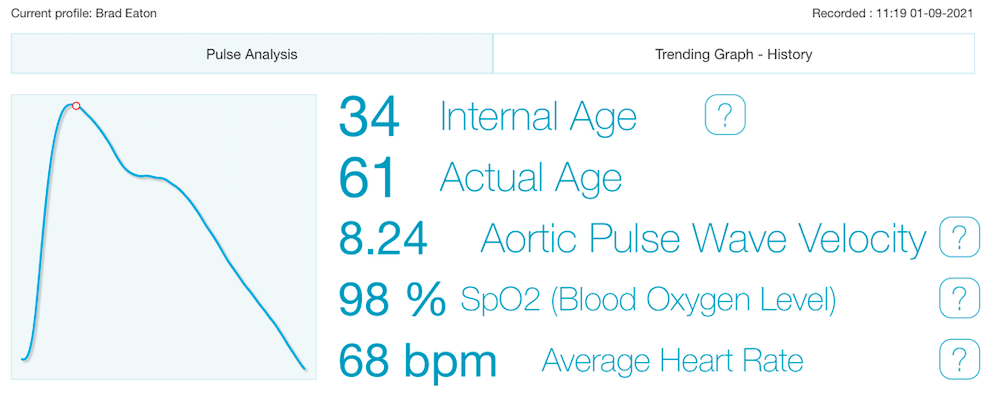
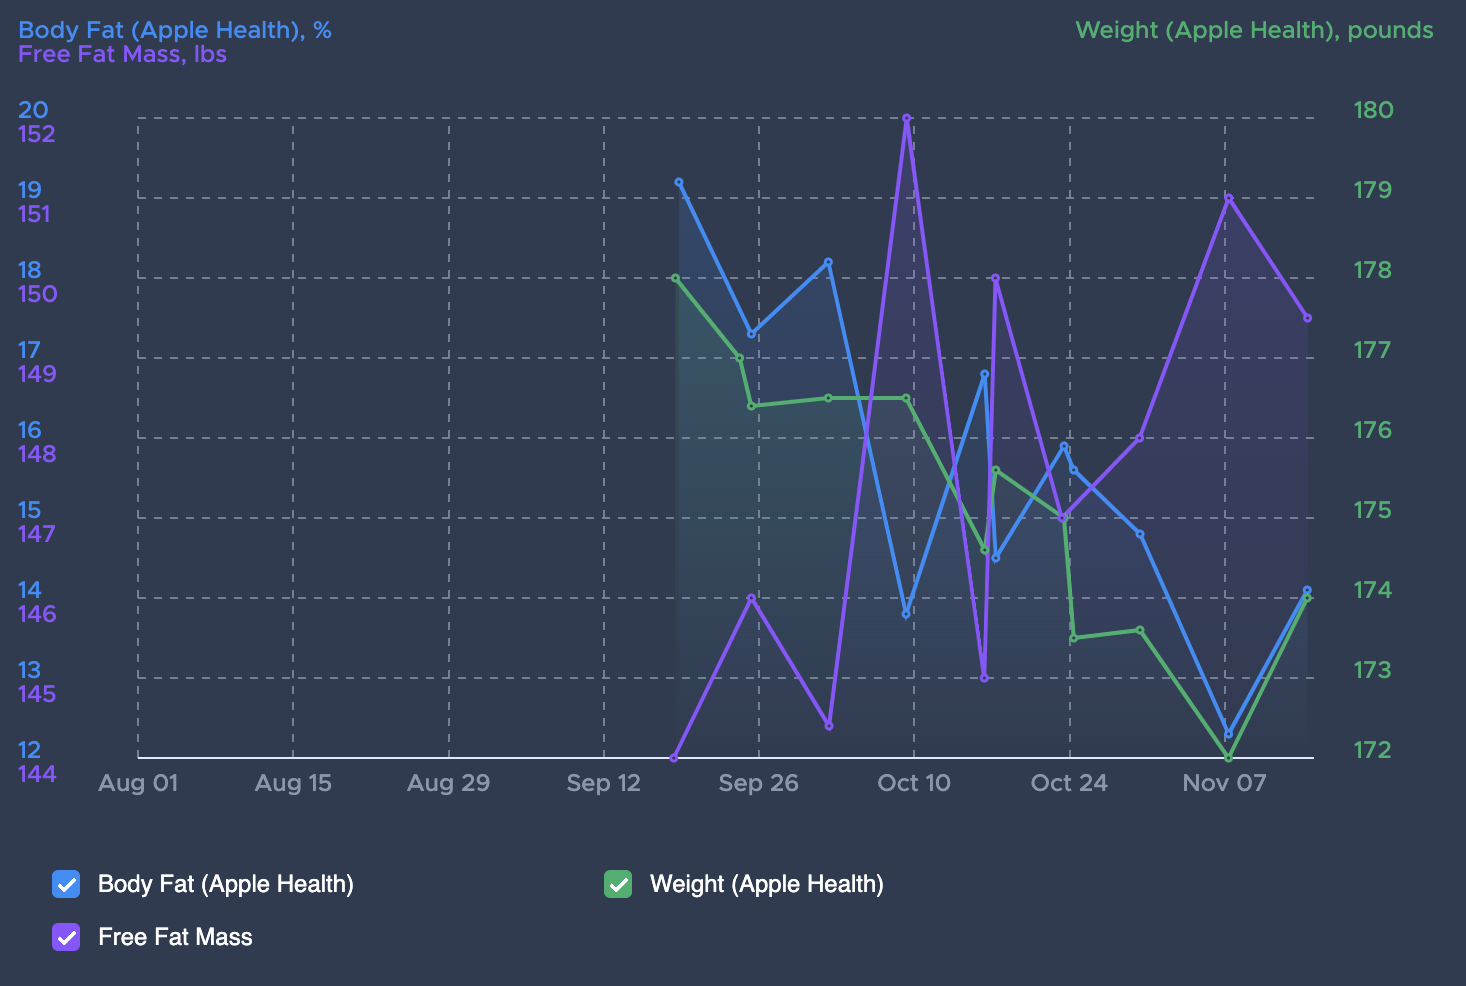
For each category below, you will find my results at the top in ( ) and then an explanation.

You should know these metrics are in the context of my genetics and lifestyle (epigenetics):

  • My father, an incredible man - triple heart bypass, carotid artery surgery, and high blood pressure.

  • My grandfather - died of heart disease.

I do not exhibit the chronic conditions they were subjected to. Now, ask yourself why?


I have struggled for some time on what approach to take to convey the whole body health Hormesis Health and Fitness offers. Im assuming people want to look good, but be healthy.

I believe a client should expect their coach to model what they prescribe. If the Coach can’t, then how accurate or realistic is the guidance?

It takes a lot of discipline and commitment to Coach.


Calculators for some of the following metrics can be found here.

(0.2mg/L) “Low Risk”

Low Risk <1, Medium Risk 1<>3, High Risk >3, Very High Risk 5>10, >10 Clinically Significant Inflammatory States. hsCRP should normally be <1.

hsCRP is a high sensitivity version of CRP. They both measure in mg/L, so CRP picks up where hsCRP leaves off.

Inflammation causes organs and cells to become dysfunctional. Inflammation contributes to insulin resistance and weight gain. Fat cells associated with obesity create constant low levels of inflammation that can affect all areas of the body, for example arteries or the hypothalamus of the brain which amongst many responsibilities includes energy balance and control of hunger. hsCRP stands for high sensitivity c-reactive protein. It is synthesized by the liver in response to factors released by macrophages (a type of white blood cell of the immune system) and fat cells (adipocytes).

(0.97) “Below LDL Size Pattern Risk” - Triglycerides 65 / HDL 67

<1.33 Distinguishes the small and large LDL size pattern.

>2.7 Cardiovascular Risk Cutoff

Atherosclerosis is a type of thickening or hardening of the arteries caused by a buildup of plaque in the inner lining of an artery. It can increase your risk of heart attack, stroke, and other circulatory conditions.

Small dense oxidized LDL particles (Phenotype B) are the significant cause of atherosclerosis.

Triglycerides below ~ 60 have also demonstrated low risk of small dense Phenotype B particles.


TyG Index (4.43) NOT suggestive of insulin resistance, NAFLD (non-alcoholic fatty liver disease) diagnosis is unlikely.

According to a study by Salazar et al. insulin resistance cut off is placed at the TyG index value of 4.49, with a sensitivity of 82.6% and specificity of 82.1% (AUC=0.889, 95% CI: 0.854-0.924)

Insulin is the primary hormone that determines use of body fat (stored energy) or glucose for energy. When cells are less insulin sensitive (some level of resistance), the body is less effective at utilizing glucose and accessing stored energy.

Uric Acid (6.8 mg/dl = 0.375 mmol/l) “Optimal”

SUA levels of 0.30-0.41 mmol/l were associated with the lowest mortality rate and should be regarded as optimal.

Recent findings suggest that uric acid could be related to the development of diabetes. Serum uric acid has been shown to be associated with oxidative stress and production of tumor necrosis factor-α, which are both related to the development of diabetes.

Aortic Pulse Wave Velocity (8.24 meters/second - Internal Age: 34; Chronological Age: 61)

Increased Aortic Pulse Wave Velocity (faster) as a result of aortic stiffening has been shown to be strongly associated with the narrowing of the inside of arteries due to the buildup of plaque. The optimal cutoff value of PWV to detect patients with high 10-year cardiovascular mortality risk was 13 meters/second.

Internal age, or biological age, is representative of the wear and tear on the body. It is what determines our health and ultimately our lifespan. We all age biologically at different rates according to our genes, what we eat, how much we exercise, stress, sleep and what environmental toxins we are exposed to. Chronological age is how old the calendar says you are, not how old we really are. It's a superficial number.

(61 bpm)

A ‘normal’ RHR ranges from 60 to 100 beats per minute - resting heart rate or basal heart rate.

For a well-trained athlete, their RHR will usually be below this, around 40 beats per minute. This is because a lower RHR is often a sign of good cardiovascular fitness and efficient heart function.

(56)

Heart Rate Variability (HRV) is an accurate, non-invasive measure of the Autonomic Nervous System (ANS) – which responds to everything: how you exercise, recover, eat, sleep and perceive stress.

Higher resting-state HRV scores signify the ability of the body to activate the Parasympathetic “rest-and-digest” response.

Lower resting-state HRV scores signify an activated Sympathetic “fight-or-flight” response or suppressed Parasympathetic activity.

(37) representative of 40-49 year old

(my age is 62 as of this reading - 2/27/2022)

38.8+/-9.6 : Males 40-49 years old*

29.4+/-7.9 : Males 60-69 years old

V̇O2 max (also maximal oxygen consumption, maximal oxygen uptake or maximal aerobic capacity) is the maximum rate of oxygen consumption measured during incremental exercise; that is, exercise of increasing intensity.[1][2] The name is derived from three abbreviations: "V̇" for volume (the dot appears over the V to indicate "per unit of time"), "O2" for oxygen, and "max" for maximum.

Oxygen is a necessary component of ATP production (cellular energy) in the mitochondria, so increasing the amount of oxygen available to your cells can increase mitochondrial density and thus improve ATP production at the cell level.

In a certain way, VO2 Max is an indiction of the health of the cell and its ability to create energy through the mitochondria (energy factories in the cell).

Decreased VO2max is correlated with impaired insulin sensitivity and was the most prevalent abnormality in a population at risk for IRS and T2DM but without overt disease. This raises the possibility that decreased VO2 max is among the earliest indicators of IRS and T2DM therefore, an important risk factor for disease progression.

 (120/80) normal for 20-24 year olds

(my age is 62 as of this reading - 2/27/2022)

 (6 cycles) 4 to 5 sleep cycles is typical

(28% REM Sleep) REM is typically 20-25% of total sleep time

(18% Deep Sleep) Deep sleep is typically 5-15%

(54% Light Sleep) Transitory sleep between Deep and REM, typically 40-60%

 (4.35)

1-2 Typical Range*

*One Disease: Redox Imbalance: How Stress Becomes Disease, Michael R Sherer, Copyright 2021.

The normal NLR values in an adult, non-geriatric, population in good health are between 0.78 and 3.53

Neutrophil-to-lymphocyte ratio (NLR) has proven its prognostic value in cardiovascular diseases, infections, inflammatory diseases and in several types of cancers.

NLR can act as a red flag alerting of a dysregulated immune system, whether from inflammation, malignancy or other causes. Critically ill patients will often have an NLR of 9 or higher. NLR tends to increase rapidly following acute physiologic stress (<6 hours).​

Under physiological stress, the number of neutrophils tends to increase whilst the number of lymphocytes decreases.

*Note: my NLR is slightly above ideal. I deal with gut health issues such as celiac disease which may extend to IBD (circumstances I believe have been encouraged by prior lifestyle)

 (6.57 umol/L) “Optimal”

High levels of homocysteine can lead to blood clots or blood vessel blockages. Artery damage or blood clots significantly raise your risk of heart disease.

Homocysteine is an amino acid. Amino acids are chemicals in your blood that help create proteins. Vitamin B12, vitamin B6 and vitamin B9 (folate) break down homocysteine to generate other chemicals your body needs.

This is a example of the MTHFR genetic test

The rise of Homocysteine levels is associated with the functioning of MTHFR. MTHFR is both a gene and an enzyme produced by the gene (methylenetetrahydrofolate reductase).

The function of MTHFR goes well beyond the effect on Homocysteine levels. 1 in 2 people have an area in the MTHFR gene that has an incorrect DNA base. This is called a polymorphism. It results in the enzyme not being able to perform its function well.

Altered function causes decreased neurotransmitter function and decreased SAMe production. Reduced neurotransmitter function affects thinking clearly, sleeping soundly, mood/depression and more. SAMe is critical to regulation of over 200+ enzymes in the body resulting in things such as cancer, infertility, miscarriage, autism, high blood pressure and cardiovascular conditions. Testing of the MTHFR gene would seem like a worthy investment.

The relationship between the fat-free mass index (FFMI) and age in male subjects by race/ethnicity based on prediction equations. The vertical line represents the peak FFMI in the mid 20s.

The relationship between the fat-free mass index (FFMI) and age in female subjects by race/ethnicity based on prediction equations.

Free Fat Mass Increase (purple)

(20.79) representative of 30 year old male caucasians / above average

(my age is 62 as of this reading)

20.80 ± 0.12 : 30 year old male caucasians*

20.05 ± 0.16 : 60 year old male caucasians

19.82 ± 0.16 : 65 years old male caucasians

Predicted fat-free mass index (± s.e.) (kgλm−2) for male individuals between the ages of 20–90 years

Predicted fat-free mass index (± s.e.) (kgλm−2) for female individuals between the ages of 20–90 years

Free Fat Mass Index (FFMI) represents weight less body fat and gives an impression of muscle mass.

The estimated turning point where FFMI started to decline was in the mid 20s for male and mid 40s for female participants. An age × gender interaction was found such that the rate of decline was greater in male than female participants (P ≤ 0.001).

After age 30, you begin to lose as much as 3% to 5% per decade. Most men will lose about 30% of their muscle mass during their lifetimes.

There is a genetic physiological maximum amount of muscle attained through hypertrophy (muscle gain without steroids). This is influenced through “Lifestyle”.

“Fat-free mass index in users and nonusers of anabolic-androgenic steroids”

E M Kouri 1, H G Pope Jr, D L Katz, P Oliva

PMID: 7496846

DOI: 10.1097/00042752-199510000-00003

  • 16 – 17: below average

  • 18 – 19: average

  • 20 – 21: above average

  • 22: excellent

  • 23 – 25: superior

  • 26 – 27: suspicious for a natural athlete, but not impossible

  • 28 – 30: essentially impossible naturally, steroid user

 (13.9%) “Low” for males 60+ years old

(my age is 62 as of this reading - 2-27-2022)

Body Fat % decrease (blue)

The examples below are for the Turkish Get-up and the StrongFirst Snatch Test. These are 2 of 7 qualifying criteria for SFG1 (StongFirst Girya Level 1)